The State of Nonprofits in America: A State-by-State Analysis

Key Takeaways
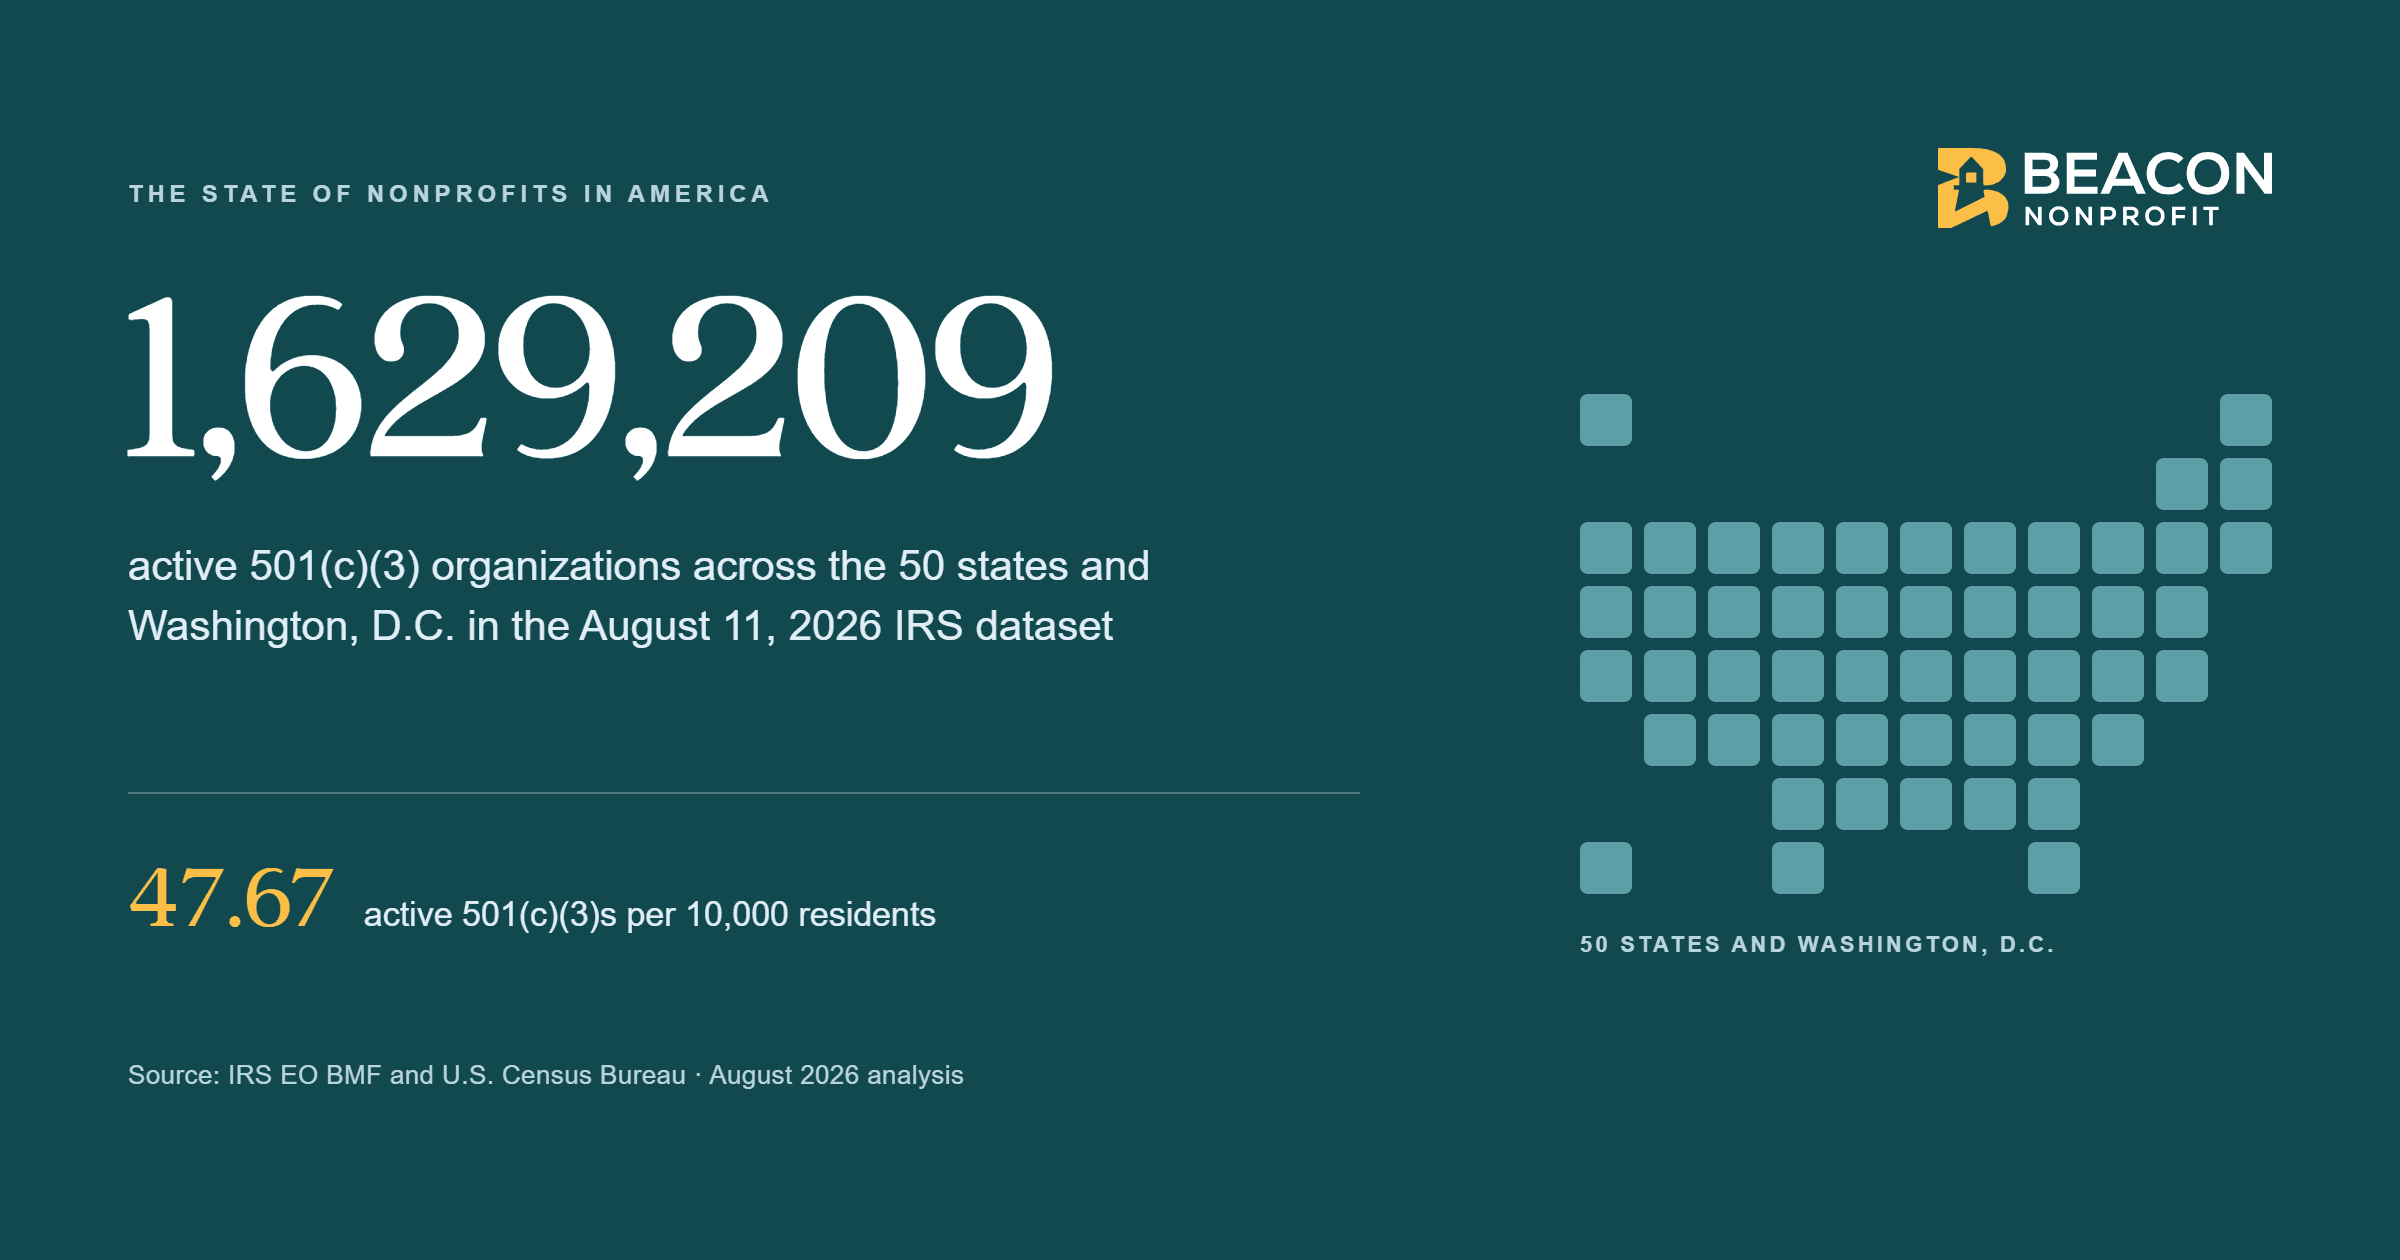
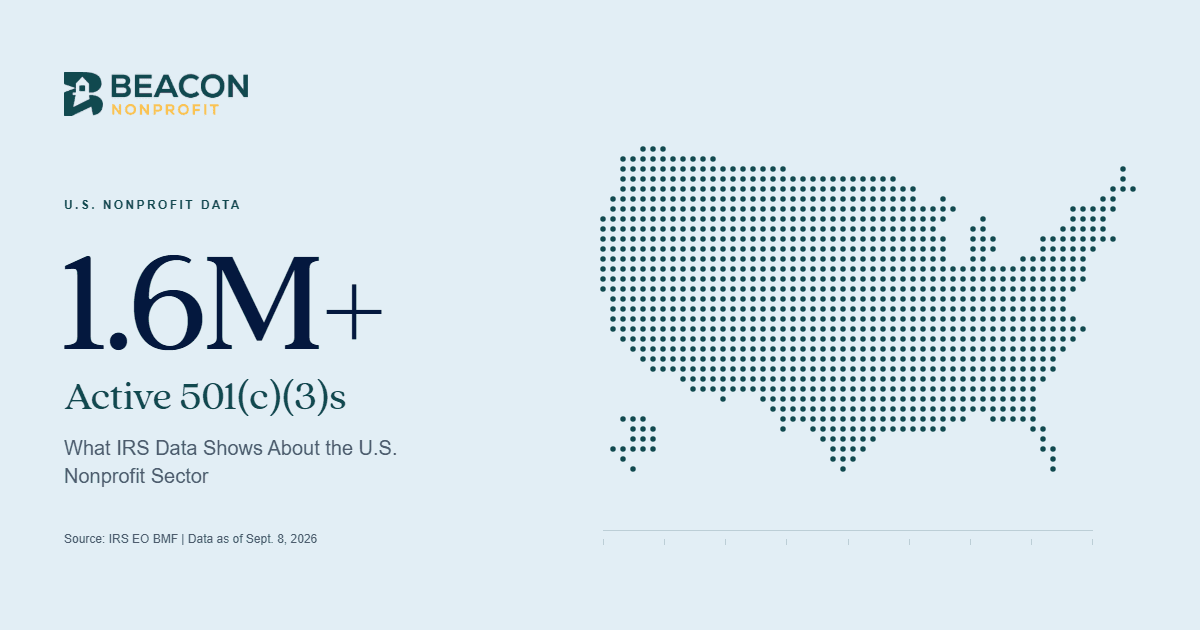
There are 1,636,144 active 501(c)(3) organizations across the 50 states and D.C., based on the IRS Exempt Organizations Business Master File updated September 8, 2026.
The national rate is 47.87 active 501(c)(3)s per 10,000 residents, but density varies widely by state. The District of Columbia leads all jurisdictions at 157.20 per 10,000.
Raw count and density tell different stories. California ranks #1 by count but #38 by density. Wyoming ranks #50 by count but #4 by density.
32.9% of active organizations in this analysis have IRS ruling dates of January 2020 or later. Ruling dates reflect IRS exemption recognition, not state incorporation.
Religion-related organizations are the most common mission area among classified 501(c)(3)s (15.8% of classified), followed by Education (14.1%) and Human Services (11.9%). 21.2% of active organizations have no NTEE classification on file.
How does the nonprofit sector differ from state to state? This analysis of IRS and U.S. Census data compares active 501(c)(3) organizations by state, population, mission area, and IRS recognition date.
As of September 8, 2026, there were 1,636,144 active 501(c)(3) organizations across the 50 states and the District of Columbia in the IRS dataset. That number, drawn from the IRS Exempt Organizations Business Master File, shows the scale of the American nonprofit sector at the time of this analysis. It does not tell you where nonprofits are most concentrated, which mission areas they serve, or how the sector has changed over time.
To answer those questions, Beacon Nonprofit analyzed the IRS Exempt Organizations Business Master File alongside U.S. Census Bureau population data. The result is a state-by-state picture of the nonprofit sector, built for founders, journalists, and researchers who want a reliable, citable source for nonprofit data. For a broader look at sector health — including size, composition, and compliance trends — see The Health and Growth of the U.S. Nonprofit Sector: What the IRS Data Shows. For a data-driven look at how tax-exempt organizations break down across all IRS classifications — not just 501(c)(3)s — see Tax-Exempt Organization Classifications: What the IRS Data Shows.
If you are new to the sector, it helps to start with a clear understanding of the types of nonprofit structures that exist before diving into the data.
How Many Active 501(c)(3)s Are There in the United States?
Quick Answer
As of September 8, 2026, there are 1,636,144 active 501(c)(3) organizations across the 50 states and the District of Columbia in the IRS dataset. Concentration varies significantly by state. Several less populous states rank among the highest for 501(c)(3)s per 10,000 residents. The national rate works out to 47.87 active 501(c)(3) organizations per 10,000 residents, based on U.S. Census Bureau Vintage 2025 state population estimates (July 1, 2025) and per-capita rates.
What Does the National 501(c)(3) Data Include?
A few important notes about what this number reflects. First, it covers only IRS-recognized organizations. Churches and certain religious organizations are not required to apply for IRS recognition, so they may not appear in this data. Second, state counts are based on the mailing address on file with the IRS, not necessarily where an organization operates. Third, this analysis includes only organizations with IRS status codes 01 (unconditional exemption) or 02 (conditional exemption). Organizations whose exemptions have been revoked are not included in the public dataset. You can read more about why nonprofits lose tax-exempt status and how that affects what the data captures. For a full breakdown of revocation data by state, see Automatic 501(c)(3) Revocations in America: IRS Data by State.
A 501(c)(3) organization must meet specific IRS requirements related to its purpose, structure, and operations. Learn more about the requirements for 501(c)(3) recognition.
Where Are 501(c)(3) Organizations Most Concentrated?
Raw count and nonprofit density tell two very different stories. California has the most active 501(c)(3)s of any state, with 177,324. But with a population of more than 39 million, that works out to 45.06 per 10,000 residents, ranking it 38th by density. Texas has the second-highest raw count at 132,888, but ranks 46th by density at 41.91 per 10,000.
Wyoming illustrates the contrast most clearly. It ranks 50th by raw count with 4,928 active 501(c)(3)s. By density, it ranks 4th at 83.70 per 10,000 residents.
The District of Columbia leads all jurisdictions at 157.20 per 10,000 residents. D.C. is a federal district, not a state, but it is included as a separate jurisdiction in this analysis because the IRS BMF assigns organizations to it by mailing address.
Top 10 Jurisdictions by 501(c)(3)s per 10,000 Residents
| Rank | Jurisdiction | Per 10,000 Residents |
|---|---|---|
| 1 | District of Columbia | 157.20 |
| 2 | Delaware | 86.73 |
| 3 | Montana | 85.57 |
| 4 | Wyoming | 83.70 |
| 5 | Vermont | 81.70 |
| 6 | Alaska | 64.02 |
| 7 | North Dakota | 62.83 |
| 8 | Maryland | 59.26 |
| 9 | Hawaii | 58.67 |
| 10 | South Dakota | 58.25 |
The five states with the lowest nonprofit density are Utah (32.00 per 10,000, rank 51), Nevada (36.03, rank 50), Arizona (36.19, rank 49), Kentucky (39.67, rank 48), and Louisiana (41.83, rank 47). These figures are presented as data points. This analysis does not speculate about the causes of density differences between states.
How Many 501(c)(3)s Are in Each State?
The table below is the primary reference for readers, journalists, and researchers looking up individual states. State totals are based on the mailing address on file with the IRS. Organizations operating across multiple states are counted only once.
Source: IRS Exempt Organizations Business Master File (September 8, 2026); U.S. Census Bureau Vintage 2025 State Population Estimates.
| Jurisdiction | Active 501(c)(3)s | July 2025 Population | Per 10,000 Residents | Density Rank |
|---|---|---|---|---|
| District of Columbia | 10,904 | 693,645 | 157.20 | 1 |
| Alabama | 22,055 | 5,193,088 | 42.47 | 44 |
| Alaska | 4,720 | 737,270 | 64.02 | 6 |
| Arizona | 27,591 | 7,623,818 | 36.19 | 49 |
| Arkansas | 13,518 | 3,114,791 | 43.40 | 42 |
| California | 177,324 | 39,355,309 | 45.06 | 38 |
| Colorado | 31,018 | 6,012,561 | 51.59 | 20 |
| Connecticut | 19,249 | 3,688,496 | 52.19 | 24 |
| Delaware | 9,193 | 1,059,952 | 86.73 | 2 |
| Florida | 102,749 | 23,462,518 | 43.79 | 41 |
| Georgia | 55,891 | 11,302,748 | 49.45 | 30 |
| Hawaii | 8,406 | 1,432,820 | 58.67 | 9 |
| Idaho | 8,546 | 2,029,733 | 42.10 | 45 |
| Illinois | 58,437 | 12,719,141 | 45.94 | 34 |
| Indiana | 34,678 | 6,973,333 | 49.73 | 28 |
| Iowa | 18,189 | 3,238,387 | 56.17 | 12 |
| Kansas | 14,677 | 2,977,220 | 49.30 | 31 |
| Kentucky | 18,274 | 4,606,864 | 39.67 | 48 |
| Louisiana | 19,316 | 4,618,189 | 41.83 | 47 |
| Maine | 8,101 | 1,414,874 | 57.26 | 11 |
| Maryland | 37,131 | 6,265,347 | 59.26 | 8 |
| Massachusetts | 37,243 | 7,154,084 | 52.06 | 21 |
| Michigan | 46,396 | 10,127,884 | 45.81 | 35 |
| Minnesota | 32,114 | 5,830,405 | 55.08 | 15 |
| Mississippi | 12,775 | 2,954,160 | 43.24 | 43 |
| Missouri | 35,030 | 6,270,541 | 55.86 | 13 |
| Montana | 9,795 | 1,144,694 | 85.57 | 3 |
| Nebraska | 11,163 | 2,018,006 | 55.32 | 14 |
| Nevada | 11,825 | 3,282,188 | 36.03 | 50 |
| New Hampshire | 7,608 | 1,415,342 | 53.75 | 16 |
| New Jersey | 45,378 | 9,548,215 | 47.53 | 32 |
| New Mexico | 9,346 | 2,125,498 | 43.97 | 40 |
| New York | 106,535 | 20,002,427 | 53.26 | 17 |
| North Carolina | 51,547 | 11,197,968 | 46.03 | 33 |
| North Dakota | 5,022 | 799,358 | 62.83 | 7 |
| Ohio | 60,987 | 11,900,510 | 51.25 | 23 |
| Oklahoma | 18,861 | 4,123,288 | 45.74 | 36 |
| Oregon | 22,339 | 4,273,586 | 52.27 | 18 |
| Pennsylvania | 65,019 | 13,059,432 | 49.79 | 27 |
| Rhode Island | 5,355 | 1,114,521 | 48.05 | 32 |
| South Carolina | 28,526 | 5,570,274 | 51.21 | 25 |
| South Dakota | 5,447 | 935,094 | 58.25 | 10 |
| Tennessee | 33,296 | 7,315,076 | 45.52 | 37 |
| Texas | 132,888 | 31,709,821 | 41.91 | 46 |
| Utah | 11,324 | 3,538,904 | 32.00 | 51 |
| Vermont | 5,267 | 644,663 | 81.70 | 5 |
| Virginia | 45,125 | 8,880,107 | 50.82 | 26 |
| Washington | 35,335 | 8,001,020 | 44.16 | 39 |
| West Virginia | 9,148 | 1,766,147 | 51.80 | 22 |
| Wisconsin | 30,555 | 5,972,787 | 51.16 | 24 |
| Wyoming | 4,928 | 588,753 | 83.70 | 4 |
| United States | 1,636,144 | 341,784,857 | 47.87 | — |
What IRS Ruling Dates Show About Active 501(c)(3)s
The IRS EO BMF Information Sheet defines the ruling date field as the date an organization received IRS exemption recognition, not the date it was incorporated under state law. These are different events, and that distinction matters when reading the trend data.
Of the 1,636,144 active organizations in this analysis, 538,645, or 32.9%, have IRS ruling dates of January 2020 or later. For a full state-by-state breakdown of ruling dates among currently active organizations, see Where Active 501(c)(3)s Have Recent IRS Ruling Dates: A State-by-State Analysis. This reflects a significant share of the active sector receiving recognition in recent years, though it does not capture the full picture. Because the public dataset does not include organizations whose exemptions have been revoked, older ruling-year cohorts are understated. Organizations recognized years ago that later lost their status are not counted. This is a known limitation of the BMF, as explained by the IRS in its technical reference documentation. You can read more about why nonprofits lose tax-exempt status and what the revocation process involves.
The table below shows ruling-year counts for active organizations in the September 2026 IRS dataset.
| Ruling Year | Count |
|---|---|
| 2020 | 45,663 |
| 2021 | 51,217 |
| 2022 | 73,570 |
| 2023 | 73,113 |
| 2024 | 102,482 |
| 2025 | 112,733 |
| 2026 (partial year, through September 8, 2026) | 79,867 |
Among active 501(c)(3)s in the September 2026 IRS dataset, more organizations have a 2025 ruling date than any other year in this analysis.
The five states with the highest share of active organizations recognized since January 2020 are Nevada (47.5%), Delaware (45.2%), Utah (41.5%), Georgia (39.3%), and Arizona (38.9%). These states have the highest share of active organizations with IRS ruling dates since January 2020. This analysis does not characterize them as the fastest-growing nonprofit sectors, as ruling-date share reflects survivorship patterns in the dataset as much as it reflects new activity.
Mission Areas Represented in the IRS Data
The IRS classifies nonprofits by mission using the National Taxonomy of Exempt Entities, or NTEE. The NTEE code on file reflects the primary mission area of each organization as recorded in the IRS BMF. Of the 1,636,144 organizations in this analysis, 347,175, or 21.2%, have no NTEE classification on file.
The five most common mission areas among organizations with an NTEE classification on file are listed below.
| Mission Area | Count | % of All Active 501(c)(3)s | % of Classified Only |
|---|---|---|---|
| Religion-Related (NTEE X) | 204,279 | 12.5% | 15.8% |
| Education (NTEE B) | 182,066 | 11.1% | 14.1% |
| Human Services (NTEE P) | 152,880 | 9.3% | 11.9% |
| Arts, Culture & Humanities (NTEE A) | 116,593 | 7.2% | 9.2% |
| Philanthropy, Voluntarism & Grantmaking (NTEE T) | 103,971 | 6.4% | 8.2% |
These categories reflect the mission areas represented by active 501(c)(3)s in the IRS data. The sector covers a wide range of purposes, from faith-based organizations and schools to community service providers and grantmaking foundations. For a broader look at how 501(c)(3) compares to other tax-exempt classifications in the IRS data, see Tax-Exempt Organization Classifications: What the IRS Data Shows. For a deeper look at how these organizations differ in structure, public charity vs. private foundation is a useful distinction to understand. If you are thinking about what mission area fits your own goals, how nonprofits get funding can also shape how you define your organization's purpose.
Methodology
This analysis is based on the following sources and methods:
- Data source: IRS Exempt Organizations Business Master File, updated September 8, 2026.
- Active organizations only: This analysis includes organizations with IRS status codes 01 (unconditional exemption) and 02 (conditional exemption).
- State assignment: State counts are based on the mailing address on file with the IRS. Organizations operating in multiple states are counted only once.
- Ruling year: The ruling date field in the IRS EO BMF Information Sheet records the date of IRS exemption recognition, not the date of state incorporation.
- BMF survivorship: The public dataset does not include organizations with revoked exemptions. As a result, older ruling-year cohorts are understated in the trend data.
- Coverage limitation: Churches and certain religious organizations not required to apply for IRS recognition may not appear in this data.
- Population source: U.S. Census Bureau Vintage 2025 state population estimates, July 1, 2025.
- Per-capita calculation: Active 501(c)(3) count divided by July 2025 population, multiplied by 10,000. Calculated by Beacon Nonprofit.
What Comes Next?
The data in this analysis reflects the breadth and reach of the American nonprofit sector. More than 1.6 million active 501(c)(3) organizations serve communities across every state, in every mission area, at every scale.
If you are thinking about adding to that number, the path from idea to recognized organization involves a series of concrete steps. How to Form a Nonprofit Organization in 8 Steps walks through the full process, from choosing a structure to filing for tax-exempt status.
Beacon Nonprofit guides founders through each of those steps. Whether you are just starting to explore the idea or ready to file, we can help you move from confusion to clarity.
Frequently Asked Questions
As of September 8, 2026, there are 1,636,144 active 501(c)(3) organizations across the 50 states and the District of Columbia, based on Beacon Nonprofit's analysis of the IRS Exempt Organizations Business Master File. This figure covers only IRS-recognized organizations with active exemption status.
The District of Columbia leads all jurisdictions at 157.20 active 501(c)(3)s per 10,000 residents. Among the 50 states, Delaware ranks highest at 86.73 per 10,000, followed by Montana (85.57) and Wyoming (83.70). Per-capita rates were calculated by Beacon Nonprofit using IRS BMF data and U.S. Census Bureau Vintage 2025 population estimates.
Nonprofit density measures active 501(c)(3)s per 10,000 residents, not raw count. California has 177,324 active nonprofits but a population of over 39 million, yielding a rate of 45.06 per 10,000 and a density rank of 38th. Texas has 132,888 active nonprofits but ranks 46th by density at 41.91 per 10,000. Large populations naturally dilute per-capita rates even when raw counts are high.
The ruling date in the IRS Exempt Organizations Business Master File is the date an organization received IRS exemption recognition, not the date it was incorporated under state law. These are separate events. Incorporation happens at the state level; IRS recognition is a federal process that can occur weeks or months later.
No. The IRS BMF includes only organizations that applied for and received IRS recognition of tax-exempt status. Churches and certain religious organizations are not required to apply, so they may not appear in this data. Organizations whose exemptions have been revoked are also excluded from the public dataset.
Related Articles

Types of Nonprofit Structures Explained
Your legal structure shapes everything from how your board operates to how you apply for tax-exempt status. Learn the main nonprofit structures, what makes them different, and how to choose the right one for your mission.

What is a 501(c)(3)? A Plain-Language Guide for First-Time Founders
A 501(c)(3) is the IRS designation that gives charitable nonprofits tax-exempt status and makes donations to them tax-deductible. This guide breaks down what it means, who qualifies, and what to expect as a first-time founder.

Why Nonprofits Lose Tax-Exempt Status
Tax-exempt status is one of the most valuable things a nonprofit can have, but it can be revoked if your organization isn't careful about compliance. This guide explains the most common reasons nonprofits lose their 501(c)(3) status, what warning signs to watch for, and what to do if it happens to your organization.

501(c)(3) Requirements: What You Need to Qualify
Understanding the IRS requirements for 501(c)(3) is the first step toward building a tax-exempt nonprofit. This guide walks first-time founders through every key 501(c)(3) qualification—from your organization's purpose to its structure and ongoing obligations, so you can move your mission forward with confidence.

Public Charity vs. Private Foundation: Understanding Nonprofit Types
Choosing between a public charity and a private foundation is an important early decision for nonprofit founders. This guide explains how each structure operates, the compliance responsibilities involved, and how to determine which model best supports your mission and long-term organizational goals.

How Nonprofits Get Funding: Complete Guide for New Founders
Launching a nonprofit takes passion. But sustaining it takes funding. From grants and donations to earned income and sponsorships, understanding where your money can come from is key to building a mission that lasts. This guide from Beacon explains the most common funding sources for new 501(c)(3) founders and how to approach each one with confidence.

How to Form a Nonprofit Organization in 8 Steps
Learn how to start a nonprofit organization in eight steps, from state incorporation and board setup to applying for 501(c)(3) tax-exempt status.
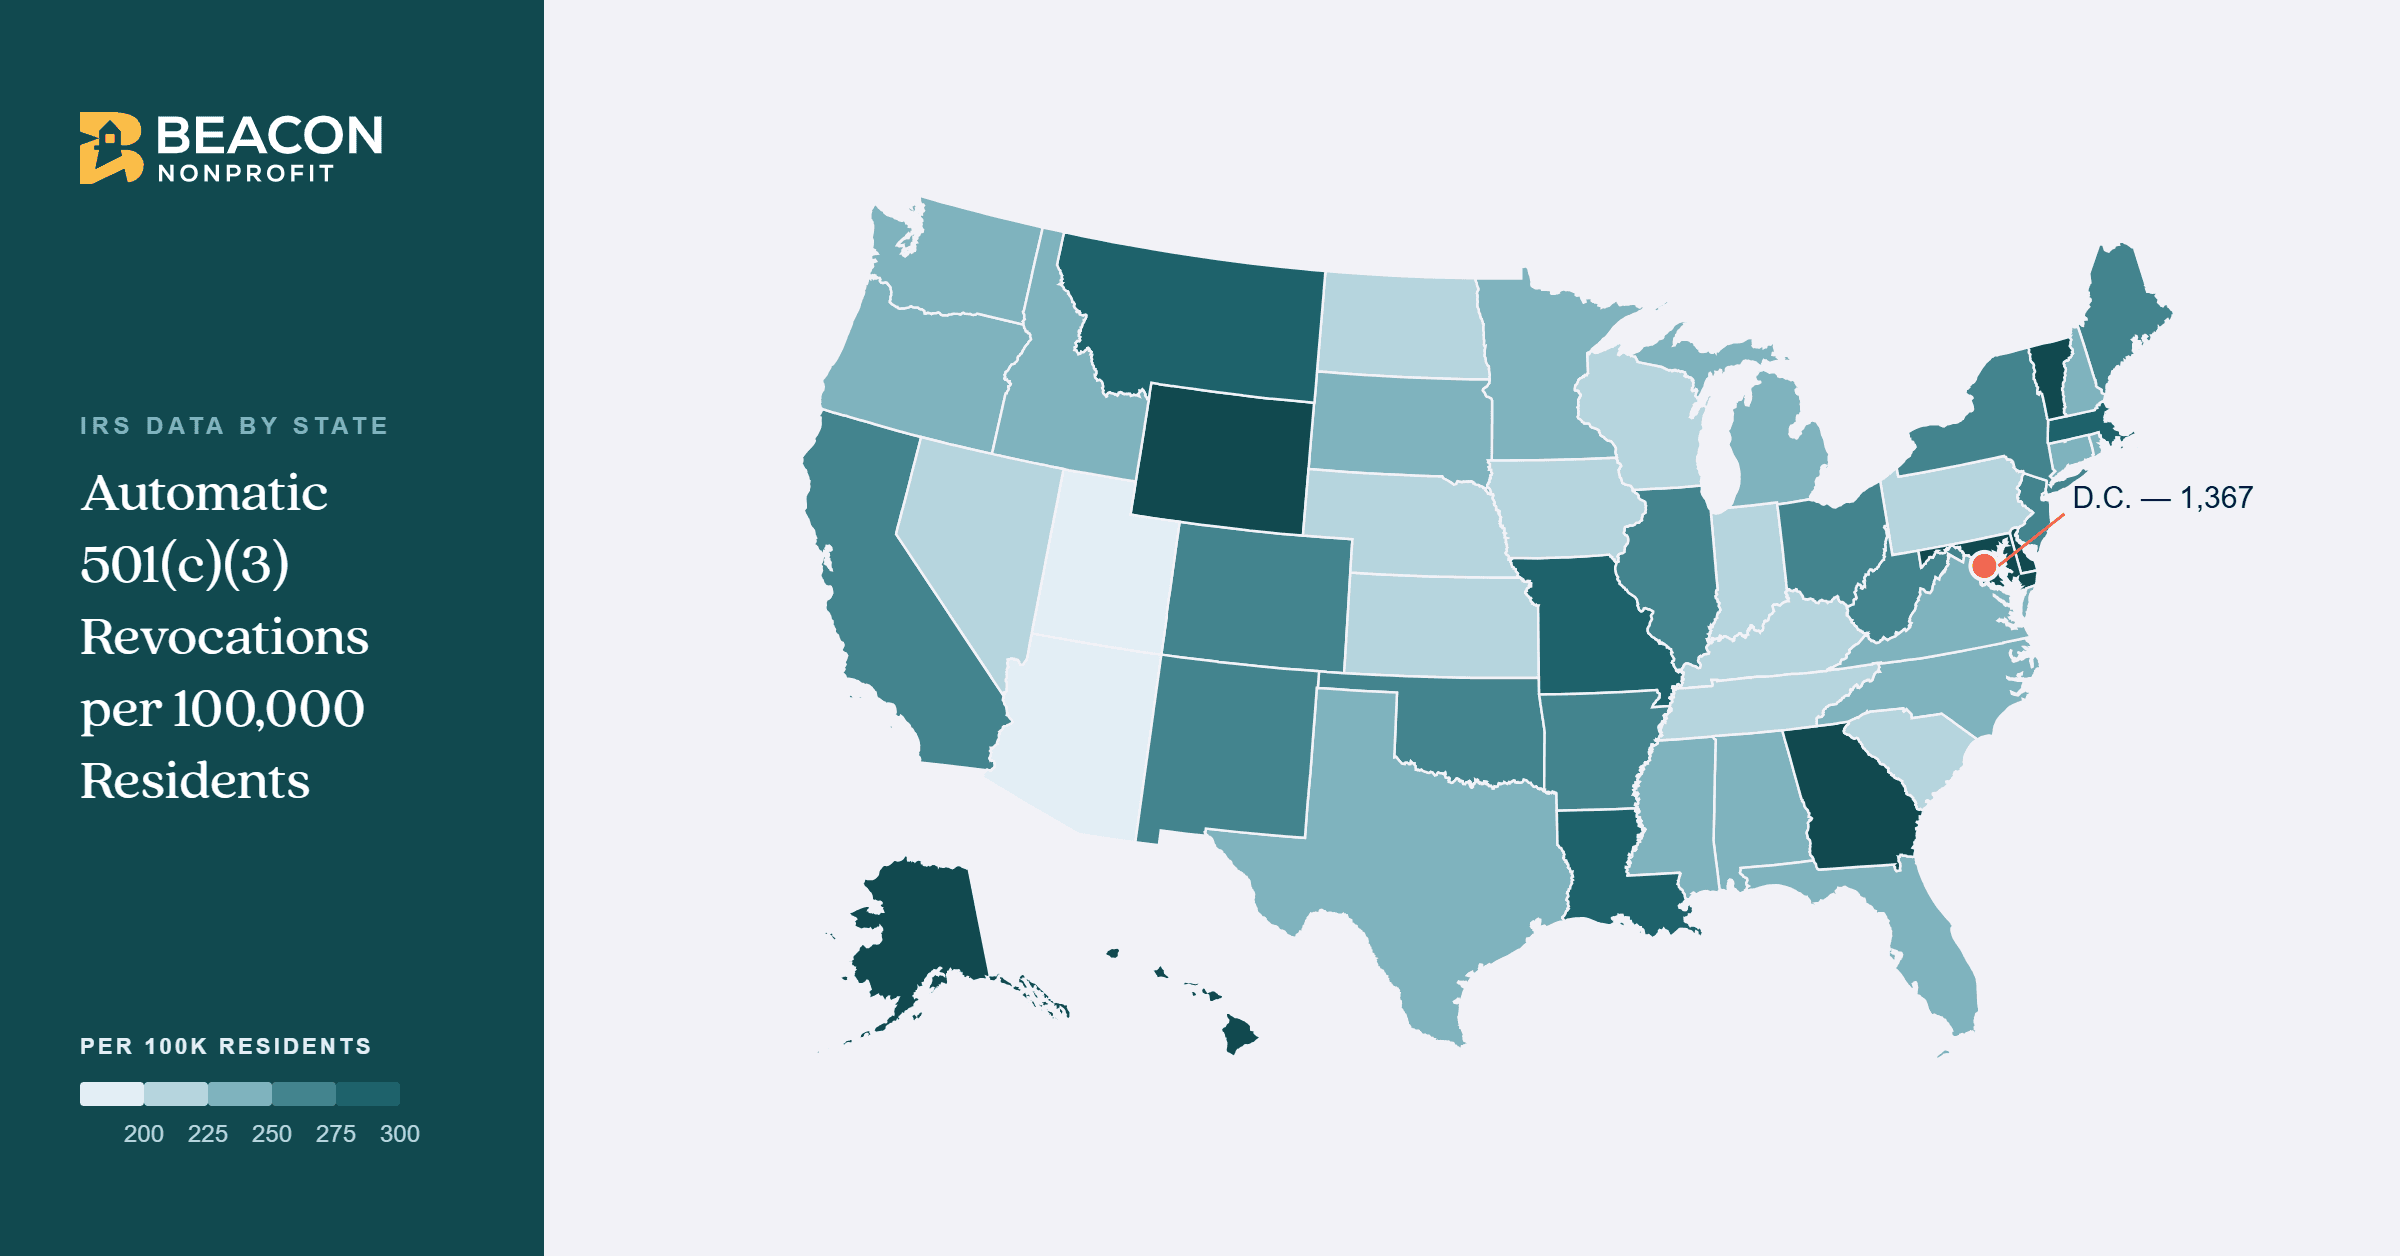
Automatic 501(c)(3) Revocations in America: IRS Data by State
See how automatic 501(c)(3) revocations vary across the United States, including state-by-state rates, historical trends, and what nonprofits need to know about maintaining tax-exempt status.
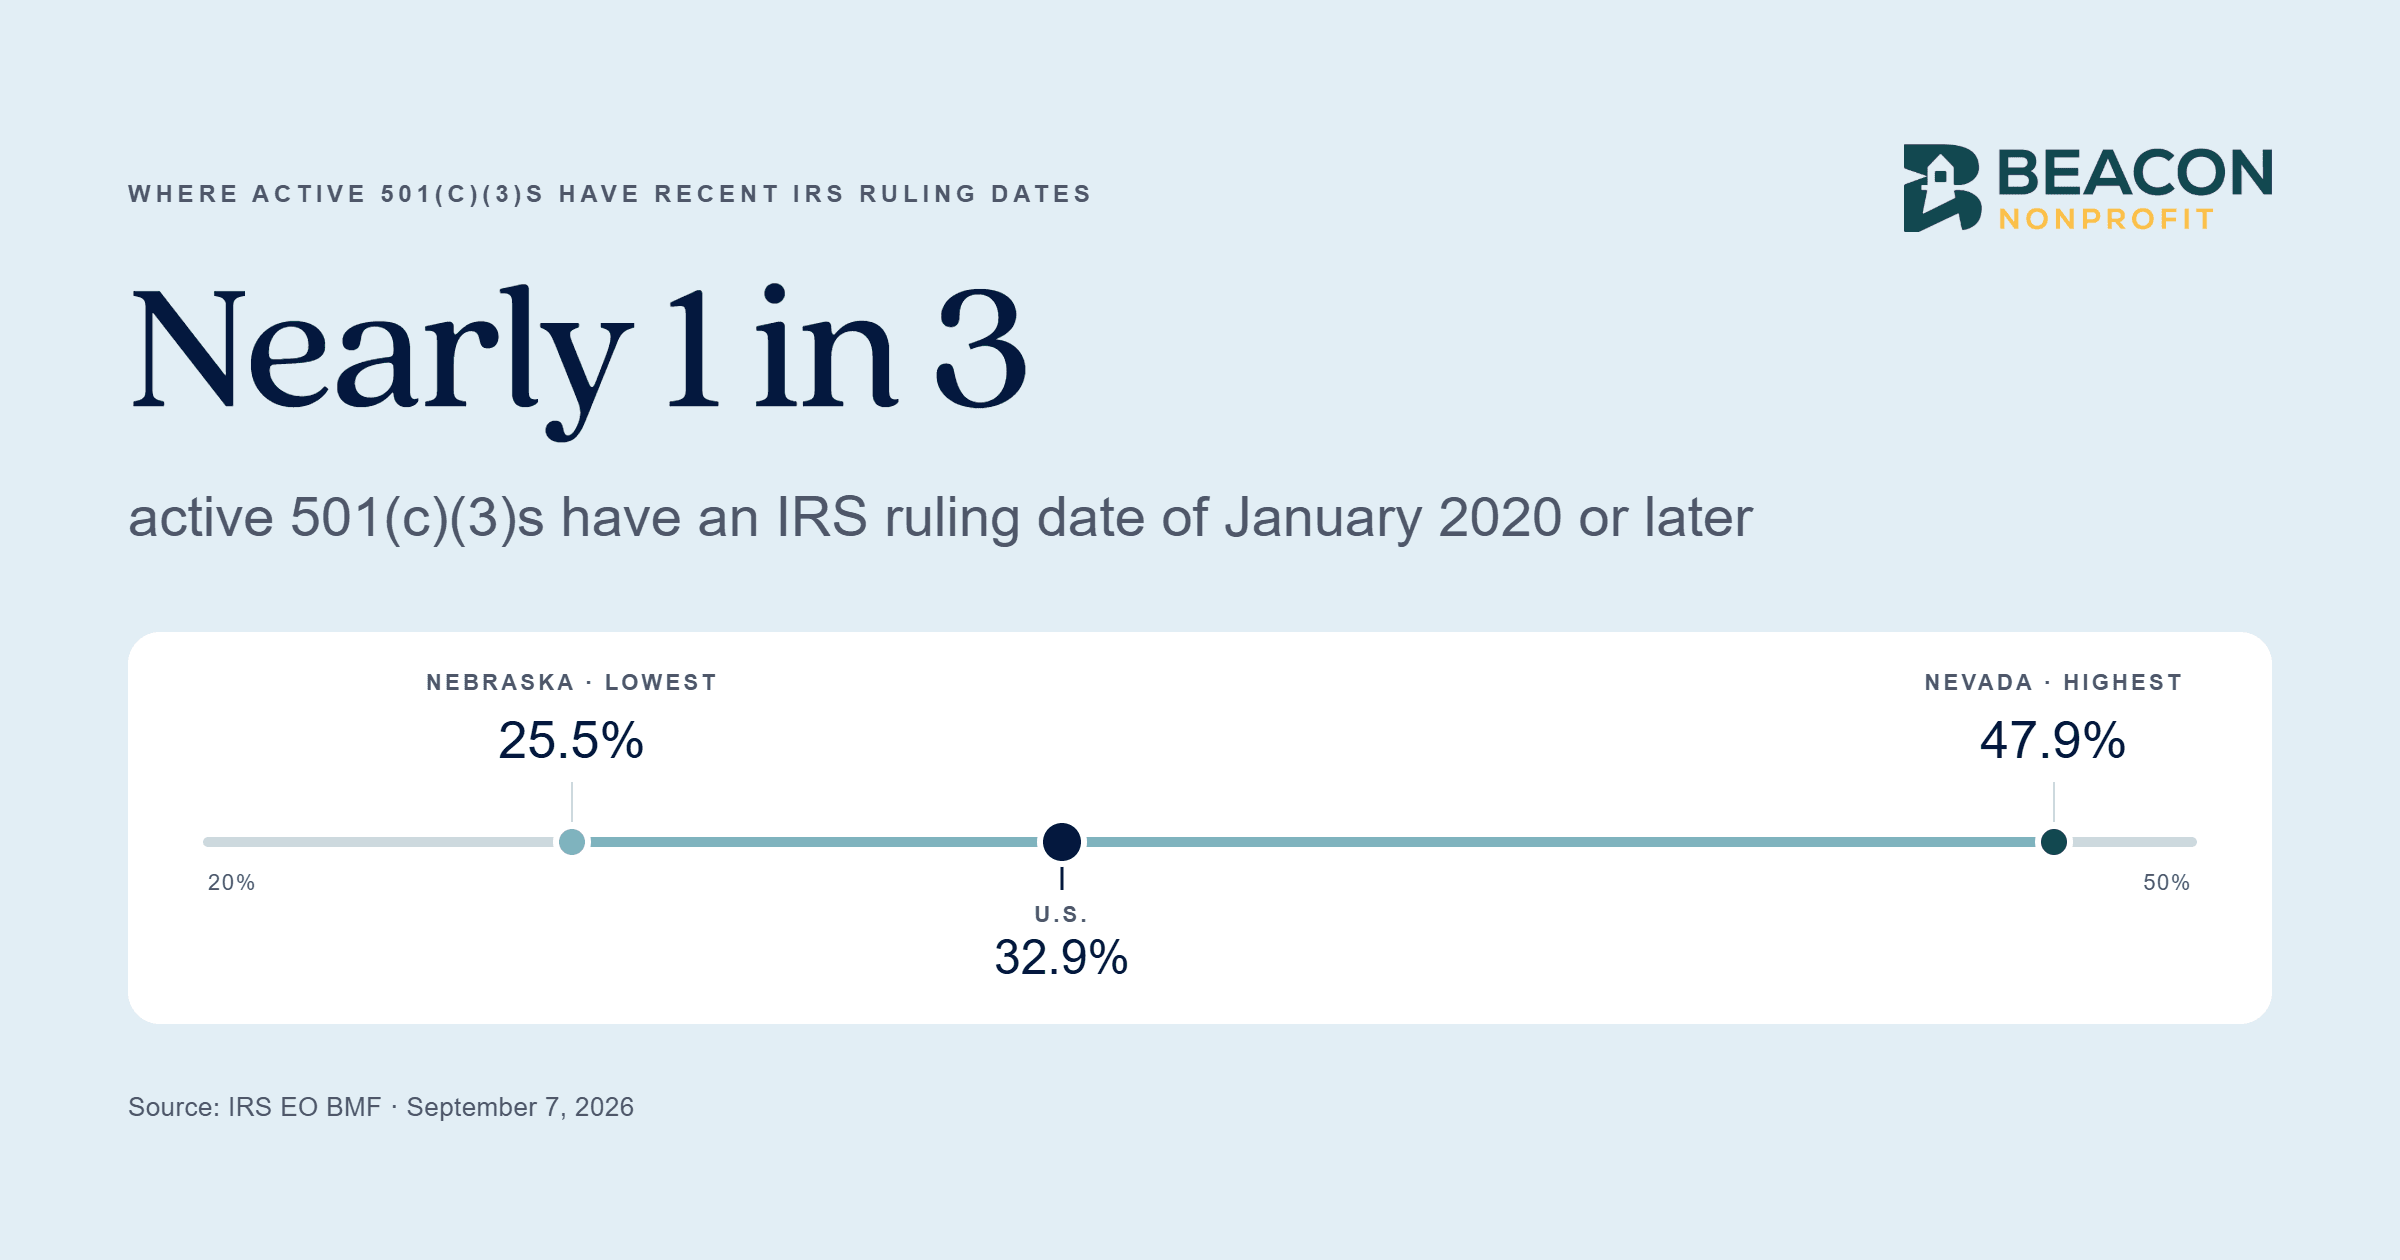
Where Active 501(c)(3)s Have Recent IRS Ruling Dates: A State-by-State Analysis
Nearly 1 in 3 active 501(c)(3) organizations in the U.S. have an IRS ruling date of January 2020 or later. Beacon Nonprofit's analysis of the IRS Exempt Organizations Business Master File reveals how that share varies across all 50 states and Washington, D.C.
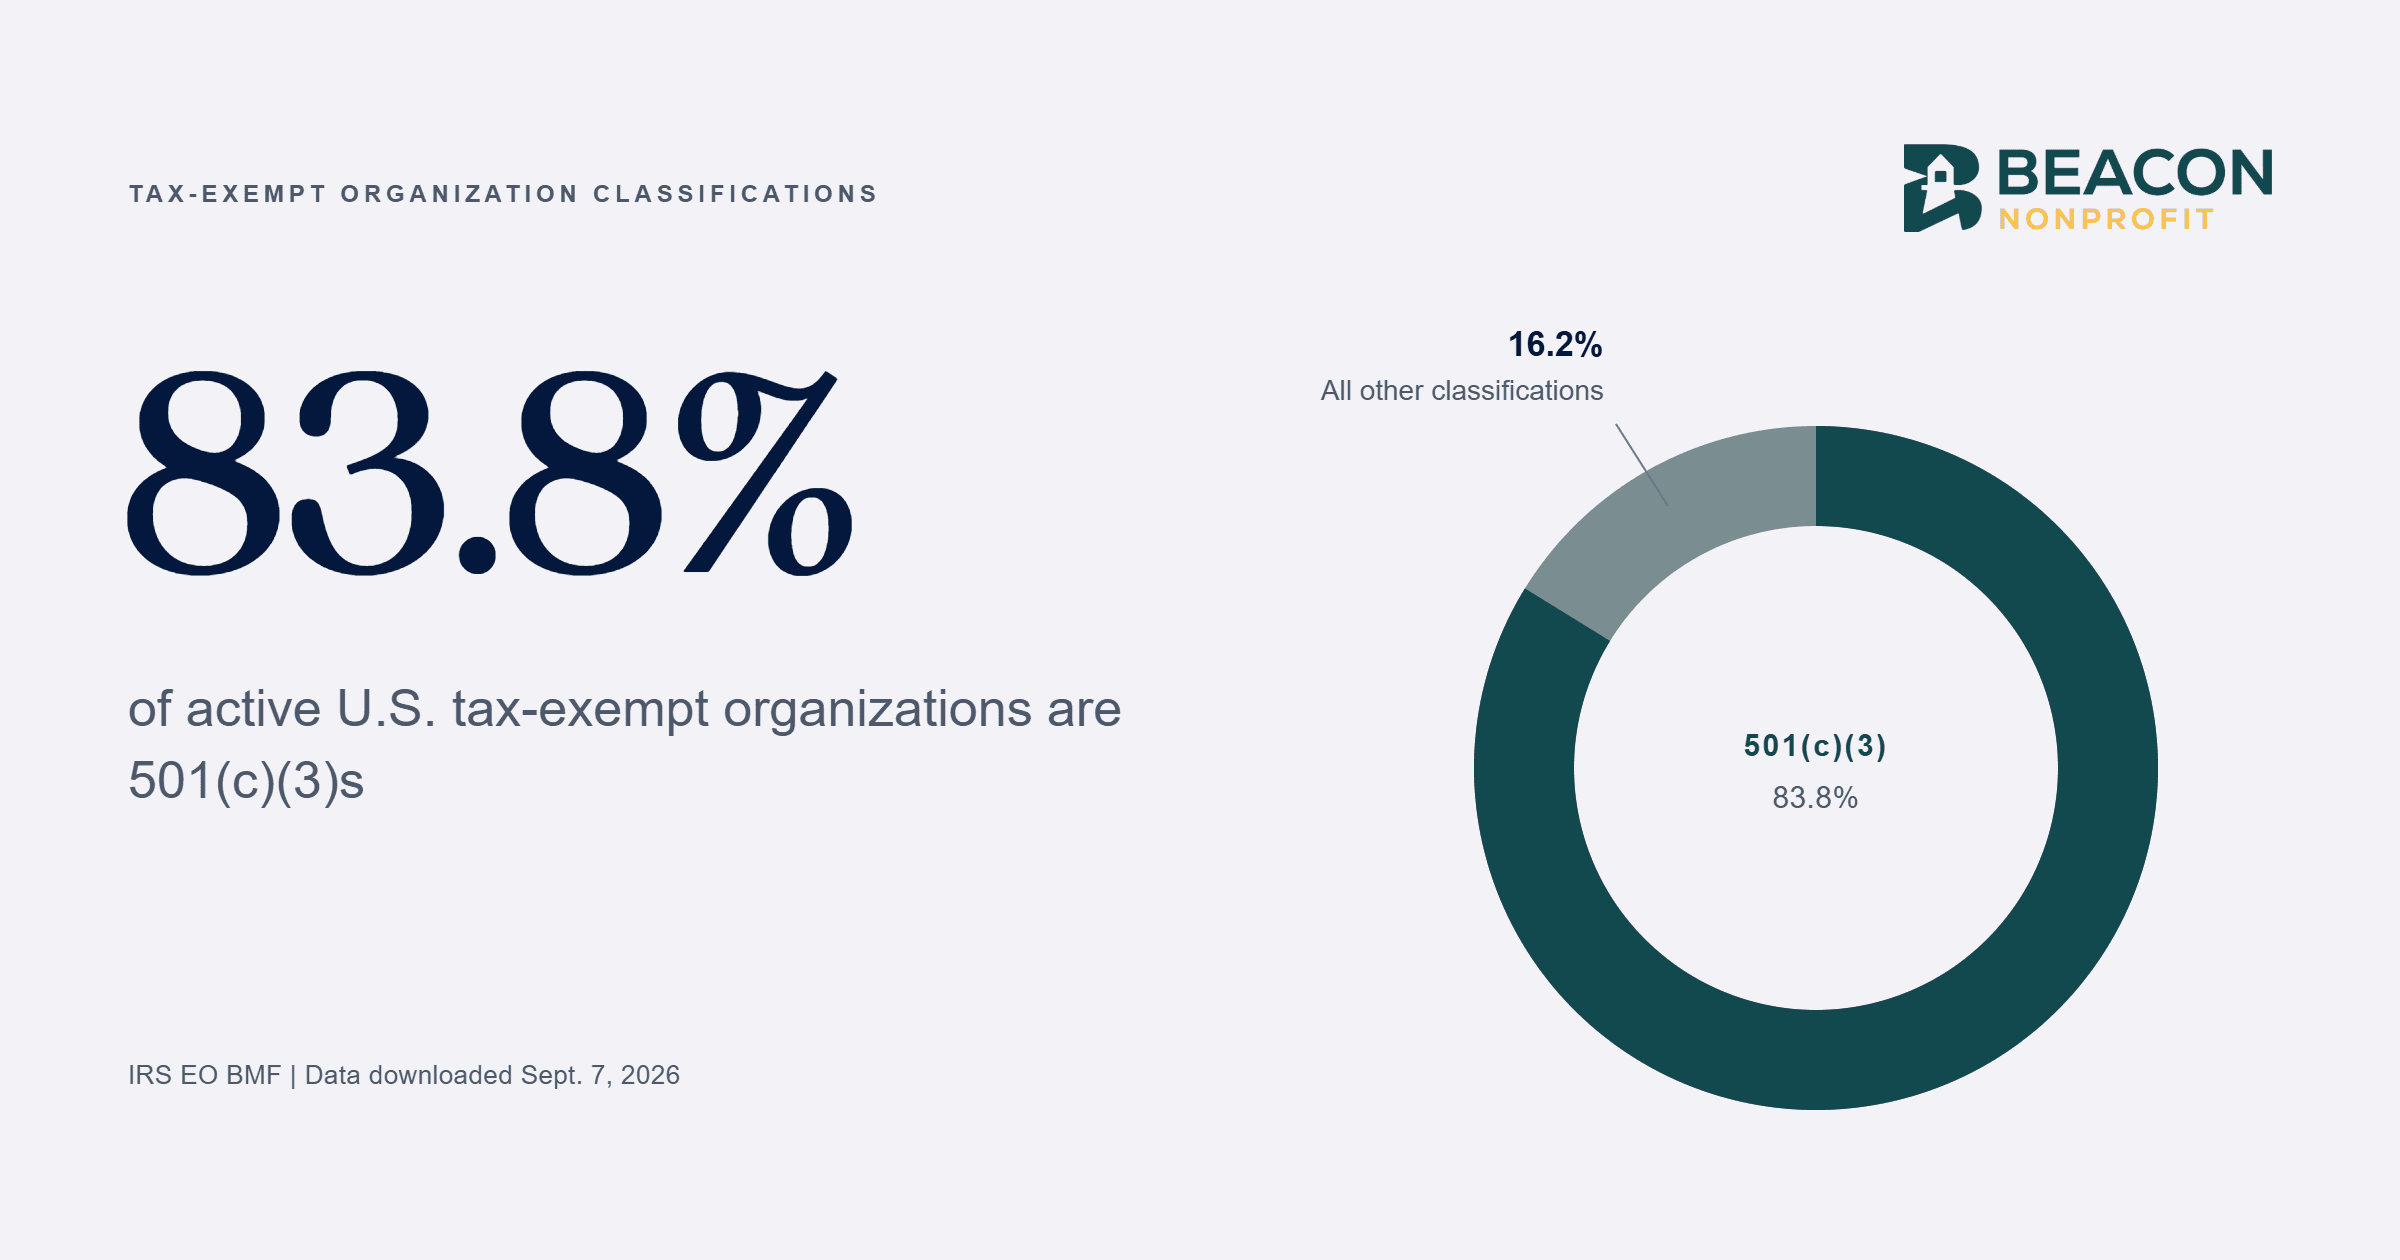
Tax-Exempt Organization Classifications: What the IRS Data Shows
According to Beacon Nonprofit's analysis of IRS Exempt Organizations Business Master File data, 501(c)(3) organizations account for 83.8% of all active tax-exempt organizations in the United States. This article breaks down how the major classifications compare, what the data shows, and how to think about classification when starting a nonprofit.

How to Apply for 501(c)(3) Tax-Exempt Status
Applying for 501(c)(3) tax-exempt status allows nonprofit organizations to receive tax-deductible donations and operate as federally recognized charities. This guide explains the steps required to apply, including forming a nonprofit corporation, obtaining an EIN, preparing governance documents, and submitting IRS Form 1023 or Form 1023-EZ.
The Health and Growth of the U.S. Nonprofit Sector
IRS data reveals a U.S. nonprofit sector of more than 1.6 million active 501(c)(3) organizations, and a third of them received federal recognition since 2020. Here's what the numbers show about sector size, composition, and long-term sustainability.
Get Nonprofit Tips and Compliance Guidance
Subscribe for updates, insights, and resources that help you stay compliant and grow your mission.